What Retailers Should Measure When Testing a New Protein Snack
Kort sammanfattat
Test a new protein snack against a fixed scorecard, not a hunch. Track rate of sale, sell-through percentage, gross margin and GMROI, basket attachment, waste and repeat purchase over a defined 8-12 week window. Compare every figure to an incumbent benchmark before you list, expand or delist.
TL;DR
- Judge a new protein snack on a fixed panel of protein snack retail metrics, rate of sale, sell-through, margin, GMROI, basket lift and repeat purchase, measured against a benchmark over a defined trial window.
Stocking a new protein snack is a bet on three things every retailer is short of: shelf space, working capital and shopper attention. The buyers who win that bet replace instinct with evidence, and that begins with choosing the right protein snack retail metrics before the first case ever lands. A structured test tells you inside a single trial window whether a product earns its facing or whether it is quietly displacing a more productive line.
Judge a new protein snack against a fixed scorecard, not a hunch: rate of sale, sell-through percentage, gross margin and GMROI, basket attachment, waste and repeat purchase, each measured over a defined 8-12 week window and compared to an incumbent benchmark before you decide to list, expand or delist.
Decide what "success" means before the first case lands
The most common testing mistake is running a trial with no pre-agreed pass mark. Without a target, every result becomes negotiable and the loudest opinion in the room wins. Set the bar first. Pick the incumbent product the newcomer would replace, write down its current performance, and state plainly what the new snack must beat to keep its space. A test is only as honest as the benchmark you commit to before you see the numbers.
Define the window as well. Eight to twelve weeks is usually enough to see past the launch spike and the novelty buyers who try anything once, while staying short enough to react before a weak line ties up cash for a season. Anything under a month tends to flatter a new product; anything over a quarter delays the delist decision that protects your margin.
Set a benchmark and a control
Numbers in isolation mislead. A rate of sale of two units a day means nothing until you know the category average, the price point and the position on the fixture. Wherever possible, run the trial in a representative cluster of stores rather than your best-performing flagship, and hold a control set stocking the incumbent so you can separate the product's merit from a good week for the whole category. If footfall, weather or a competing promotion lifts every snack, your control tells you so.
Normalise for space too. A snack given three facings at eye level should out-sell one buried at the bottom shelf, so compare productivity per facing and per linear metre, not raw units. This is the difference between a product that genuinely performs and one that simply had the best real estate.
The protein snack retail metrics that predict a keeper
A handful of figures do most of the predictive work. Treat these as your core panel and capture them consistently across every store in the test.
Rate of sale
Rate of sale, usually expressed as units per store per week, is the cleanest early signal of demand. It strips out how many stores stock the line and how much stock you hold, and answers the only question that matters at launch: are shoppers actually reaching for it? Track the trend, not just the average. A rate of sale that holds or climbs after the first fortnight is a far better sign than a big opening week that fades.
Sell-through percentage
Sell-through is units sold as a share of units received over the period. It links demand to the stock you committed and exposes over-ordering that a healthy rate of sale can hide. A high rate of sale with low sell-through means you bought too deep; a modest rate of sale with high sell-through and empty pegs means you are losing sales to gaps. Both are correctable, but only if you are measuring them.
Gross margin and GMROI
Velocity without margin is a trap. Read cash margin per unit alongside percentage margin, because a fast-selling snack on a thin margin can earn less real money than a slower line with healthy pounds-per-unit. Then step up to GMROI (gross margin return on inventory investment), which divides gross margin by average inventory cost. GMROI is the single figure that tells you whether the shelf space is working financially: it rewards products that turn quickly on a modest stockholding and penalises slow lines that lock up cash, regardless of how attractive the headline margin looks.
Basket behaviour and the halo you cannot see on the SKU
Some products earn their place less by their own sales than by what they add to the basket. Use loyalty or transaction data to check attachment: what else sits in the basket when the new snack is bought, and is the average transaction value higher for those baskets? A protein snack that recruits new shoppers into the category, or lifts spend on drinks and lunch-to-go, may justify a slimmer direct margin. Equally, watch for cannibalisation. If the newcomer simply steals sales from an incumbent you already earn well on, incremental value is close to zero even when its own rate of sale looks strong. Incrementality, not gross units, is what grows the category.
Repeat purchase: the metric that separates a fad from a fixture
Trial is easy to buy with a launch promotion; repeat is not. The share of buyers who return for a second and third purchase is the strongest signal that a protein snack has a durable place on your shelf rather than a novelty spike. If you have loyalty data, measure the repeat rate and the time between purchases. Without it, use the post-promotion rate of sale as a proxy: a product that holds most of its velocity once the introductory offer ends has genuine pull, while one that collapses to a trickle was renting demand, not building it.
Operational metrics buyers forget until they hurt
Commercial figures decide whether a product should sell; operational figures decide whether it actually can. Track these in parallel:
- Availability and out-of-stocks: a strong seller that is frequently off-shelf will read as a weak performer. Audit on-shelf availability before you blame the product.
- Waste and shrink: for anything with a defined shelf life, measure markdowns and write-offs. A snack that sells but expires on the peg erodes the margin the scorecard promised.
- Shelf life and case configuration: longer shelf life lowers waste risk and eases replenishment; case sizes that mismatch your rate of sale force either overstock or constant gaps.
- Supply reliability: fill rate and lead-time consistency from the supplier determine whether a promising test can scale without gaps. A private-label or manufacturer partner that ships complete and on time protects the numbers you worked to earn.
Reading the pack: how a protein snack sits next to protein powder and bars
Many shoppers reaching for a protein snack are the same people who buy protein powder, ready-to-drink shakes or protein bars. That matters for two reasons. First, it defines the incrementality question: is the snack recruiting fresh demand or shifting spend within a basket you already capture? Second, it sets the bar the pack has to clear. Protein-seeking shoppers read labels, so the "protein" claim needs to survive scrutiny, grams of protein per serving in proportion to calories, a clean and recognisable ingredient list, and formats that suit an on-the-go occasion that powders and tubs do not serve. A snack that offers a credible protein contribution in a grab-and-go format has a defensible reason to exist alongside the powder aisle rather than competing head-on with it.
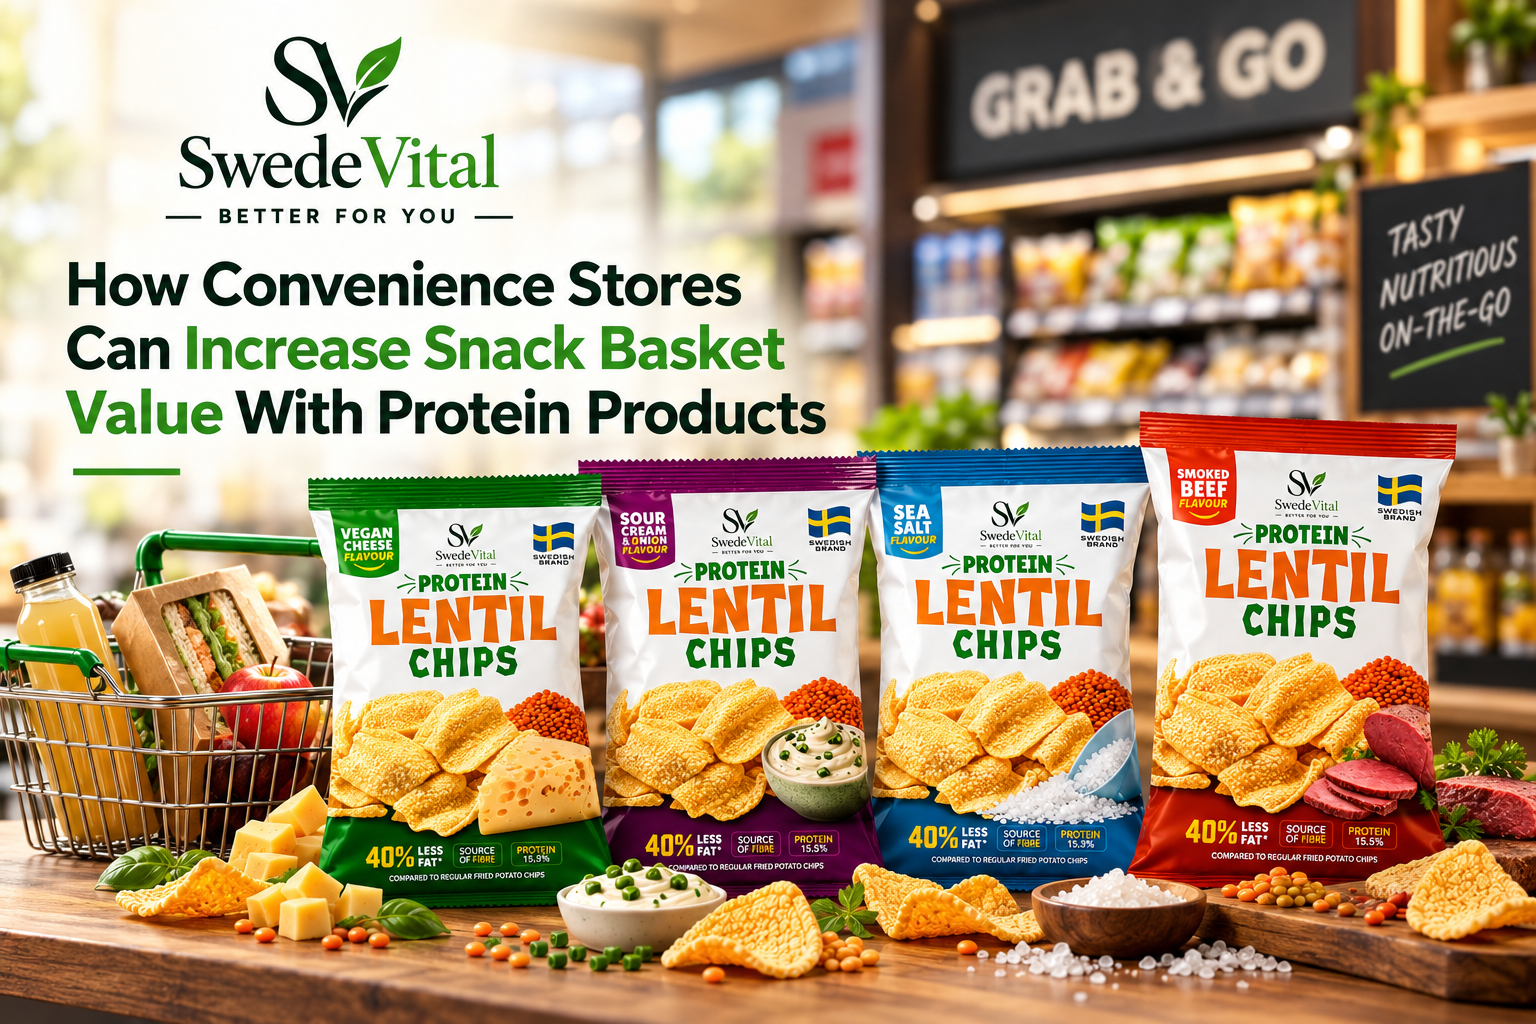
Ranges built for this, such as protein lentil chips, protein bites and protein bars, tend to test well when the buyer can point to a clear occasion the format owns. Match the claim to the shopper and let the metrics confirm it.
Building your protein snack retail metrics scorecard
Pull the panel together into one repeatable scorecard so every new protein snack is judged the same way. A workable order:
- Set the benchmark: name the incumbent and record its current rate of sale, margin and GMROI.
- Define the window and stores: 8-12 weeks across a representative cluster, with a control set.
- Capture the core panel: rate of sale, sell-through percentage, cash and percentage margin, and GMROI, normalised per facing.
- Add basket and repeat: attachment, average transaction value, incrementality and repeat-purchase rate.
- Check operations: on-shelf availability, waste, shelf life and supplier fill rate.
- Decide against the pass mark: list and expand, hold for another cycle, or delist, based on the numbers you agreed up front, not the launch-week excitement.
Applied consistently, these protein snack retail metrics turn a subjective listing debate into a decision you can defend to your finance team and repeat for the next product that hopes to earn a facing.
Frequently asked questions
What is the single most important metric when testing a new protein snack?
There is no single winner, but if forced to choose, GMROI comes closest because it combines margin and stock turn into one figure that reflects how hard the shelf space is working. In practice, read it alongside rate of sale and repeat purchase so you separate genuine demand from a promotion-fuelled spike.
How long should a protein snack trial run?
Eight to twelve weeks is a sensible default. That is long enough to see past the launch spike and the novelty buyers, and short enough to delist a weak line before it ties up cash and shelf space for a full season.
How many stores do I need to test in?
Test in a representative cluster rather than a single flagship, and keep a control set stocking the incumbent. A spread of typical stores tells you how the product behaves in normal conditions and lets you separate the product's merit from a good period for the whole category.
Do protein snacks cannibalise protein powder and protein bar sales?
They can overlap, because many buyers shop across the whole protein category. Use basket data to check whether the snack is adding incremental demand or simply shifting spend you already capture. Formats built for a grab-and-go occasion tend to be more incremental than direct substitutes for a tub of protein powder.
How do I measure repeat purchase without loyalty data?
Use post-promotion rate of sale as a proxy. If velocity holds once the introductory offer ends, the product has real pull; if it collapses, the early sales were rented by the discount rather than earned by the product.
Should a high margin outweigh a slow rate of sale?
Not on its own. A high headline margin on a slow line can still lock up cash and under-earn versus a faster product. GMROI settles the argument by weighing margin against the inventory you carry, which is why it belongs at the centre of the scorecard.
Vanliga frågor
What is the single most important metric when testing a new protein snack?
There is no single winner, but if forced to choose, GMROI comes closest because it combines margin and stock turn into one figure that reflects how hard the shelf space is working. In practice, read it alongside rate of sale and repeat purchase so you separate genuine demand from a promotion-fuelled spike.
How long should a protein snack trial run?
Eight to twelve weeks is a sensible default. That is long enough to see past the launch spike and novelty buyers, and short enough to delist a weak line before it ties up cash and shelf space for a full season.
How many stores do I need to test in?
Test in a representative cluster rather than a single flagship, and keep a control set stocking the incumbent. A spread of typical stores shows how the product behaves in normal conditions and lets you separate its merit from a good period for the whole category.
Do protein snacks cannibalise protein powder and protein bar sales?
They can overlap, because many buyers shop across the whole protein category. Use basket data to check whether the snack is adding incremental demand or simply shifting spend you already capture. Grab-and-go formats tend to be more incremental than direct substitutes for a tub of protein powder.
How do I measure repeat purchase without loyalty data?
Use post-promotion rate of sale as a proxy. If velocity holds once the introductory offer ends, the product has real pull; if it collapses, the early sales were rented by the discount rather than earned by the product.
Should a high margin outweigh a slow rate of sale?
Not on its own. A high headline margin on a slow line can still lock up cash and under-earn versus a faster product. GMROI settles the argument by weighing margin against the inventory you carry, which is why it belongs at the centre of the scorecard.